It was a test to gain experience in the web development and information management for the "big" portal, first release scheduled end December this year.
We are getting our feet wet on many different levels:
- Gathering all available information, tracking who is the owner of the material, who updates it, who checks for consistencies
- Exploring the technical tools available to actually construct the website
- Exploring different ways to support and manage the website
Anyone who constructed a website will be familiar with these challenges, no?
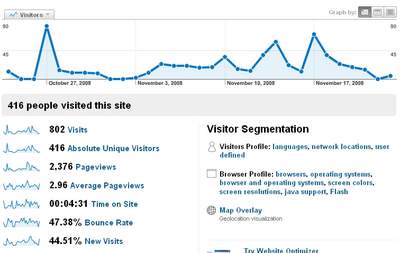
One of the tools we implemented on the Portal tryout sites is "Google Analytics", a freeware webmaster tool, tracking the usage of the portal. This helps us track which parts of the Portal are accessed the most, which type of documents are used the most, the way users navigate through the site, the duration of "a visit" on particular pages, etc... This helps us identify issues and optimize the design of the website. It is also a monitor to see "how much this tool we built is actually used"...
So, every week, Evy runs the statistics on the use of the tryout sites, which look like this:
She then pours the information in a simple spreadsheet that allows us to track -on a weekly basis- the amount of visits the website has, and how many pages are being viewed:
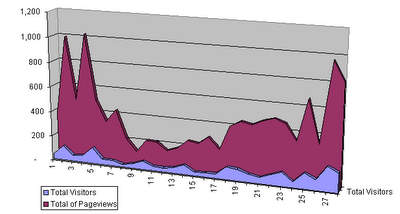
As you can see in the graphs, last week the Portal had 155 visitors, viewing over 800 pages. Not bad if you consider the site has only been released for internal use, to WFP logistics officers!
0 comments:
Post a Comment